By
By
New-build premium
I have referred to a 'new-build premium'. New homes typically sell at a premium compared to second-hand properties. There are several reasons for this, including:
- They are more modern and have newer features, such as freshly installed bathrooms and kitchens, while second-hand properties tend to be more dated and generally require capital to be spent on them to bring them up to date;
- New homes are more efficient and have lower running costs;
- New homes have insurance that protects buyers against defects;
- Some new-build properties have amenities such as gyms and other facilities which owner-occupiers are willing to pay more for; and
- There is less risk regarding major defects which may occur over time, such as subsidence or termites, etc.
Market factors
Many countries have schemes specifically designed to help first-time buyers get on to the housing ladder. This means that first-time buyers have more capacity to pay more for new-build property, as they can borrow more money.
How does it work?
The new-build premium is not a fixed amount; it is simply a premium that shifts with the market cycle:
- As the economy expands, demand for property increases. As demand increases, prices increase, and so does the new-build premium.
- As demand decreases and the market contracts, developers must either lower their prices to sell a property or build less property in order not to create a glut of new property in the market. However, it is not possible for developers to simply turn off the supply. So, they must reduce their prices to sell. As prices reduce, so does the new-build premium.
The easiest way to demonstrate the new-build premium is to use the UK Nationwide House Price Index – it tracks average prices for both new and second-hand properties. Over the past 60 years in the UK, the average new-build premium has fluctuated from between 32.8% in 1982 to virtually zero (0.22%) in 2010.
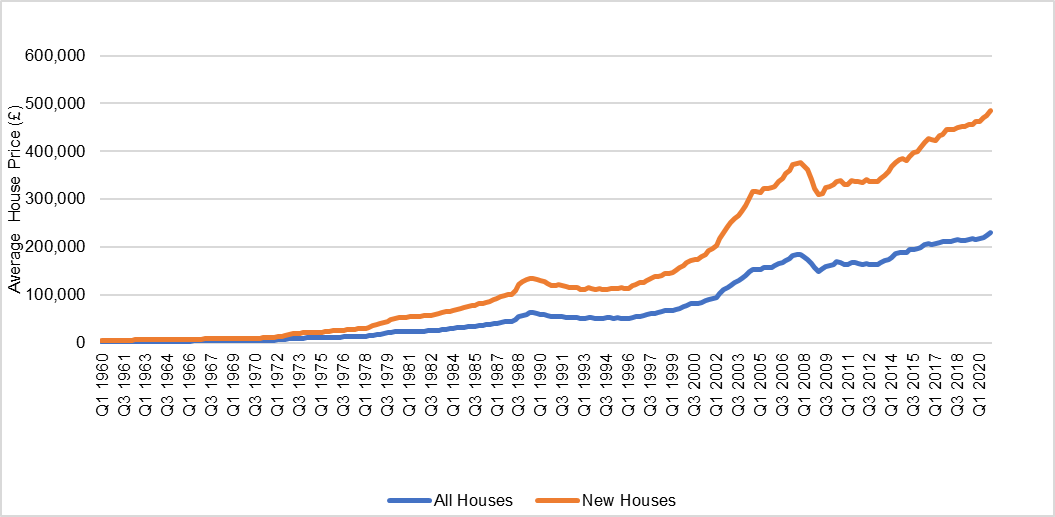
Figure 1.4: UK Nationwide House Price Index, new-build premium, 1960–2020
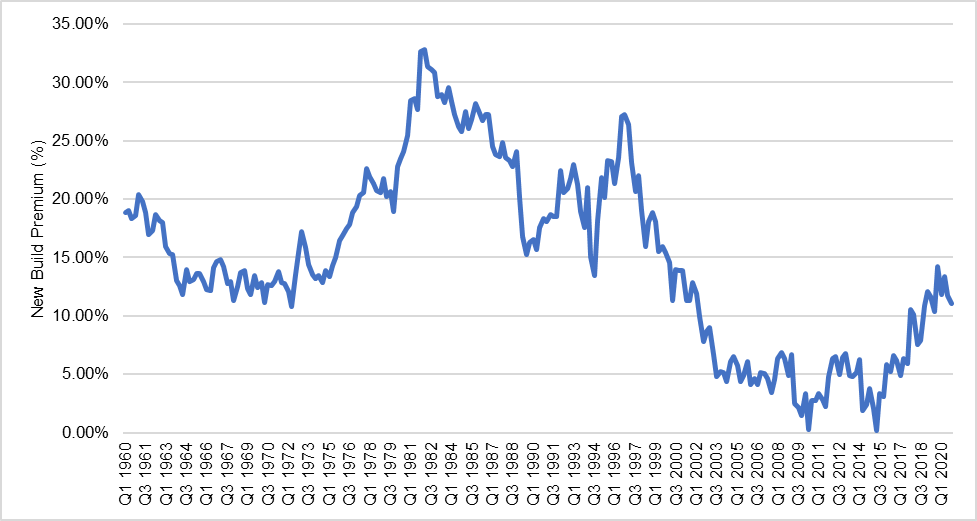
Figure 1.3: UK Nationwide House Price Index, new homes and second-hand, 1960–2020